Rise up citizen software engineers!
How I created the UK Election Petition Tracker in a few hours.
Saturday 23 Nov, 2024. Somewhere in Leeds. While Storm Bert raged outside, inside I was raging about how the new “Labour Government” in the UK was doing more lying, gaslighting, and creating collective harm in the UK whilst throwing £billions to other countries. Millions of people in the UK are upset, for many and multiple reasons, and up popped an outlet: a Parliament petition for a new General Election.
When I clicked on the link, it had 42k signatures. Then later, it had 52k. “Hey up,” I said in my Yorkshire accent, “There might be summat to this!”.
I quickly got bored of clicking refresh on the petition page, so I wrote a Python script on my laptop to do it for me. But, rather than scratch my fast balding head and try to remember how (I have done web scraping before), I decided to ask my friend, colleague, co-worker, and co-pilot: ClaudeAI (by Anthropic).
- What elements to scrape on parliament.gov.uk?
- Ask ClaudeAI how to write a Python scraper
- Asking ClaudeAI to help write a Streamlit app
- Create a Github repo
- Create a Github access token for the app
- Write the Python code for the Streamlit app
- Run the app locally on laptop
- Deploying the UK Petition Tracker to Streamlit Community Cloud
- Sharing the UK Petition Tracker online
What elements to scrape on parliament.gov.uk?
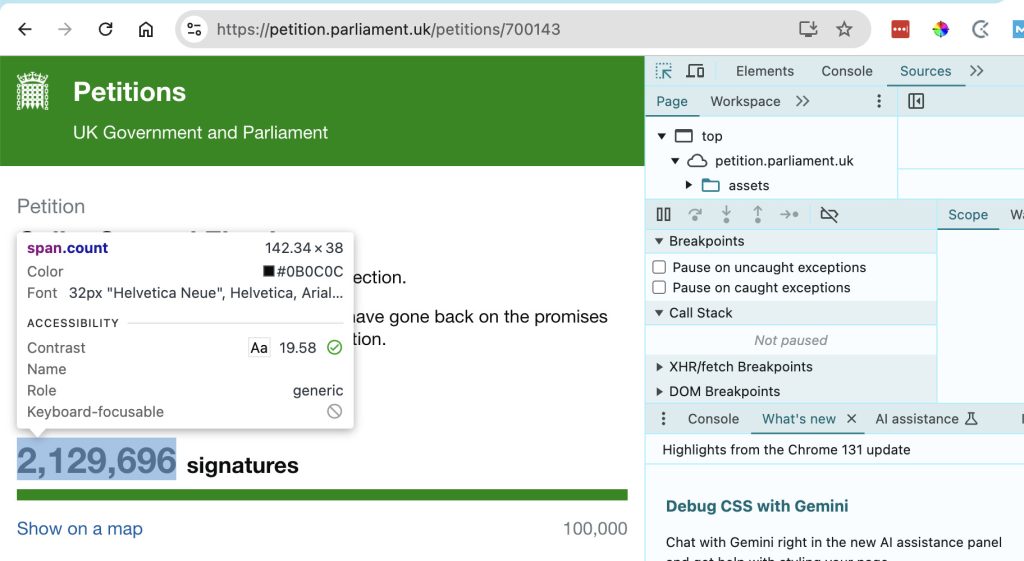
First of all — because I know what it’s going to need — I went to the Parliament UK website, opened the Chrome Developer Tools Inspector, and found the element I wanted to track: “span.count”…
Ask ClaudeAI how to write a Python scraper
With this element identified (and with web scraping, this is as easy as it gets because the parliament.gov.uk website is excellent and doesn’t his information behind JavaScript), I could then ask ClaudeAI:

The resulting code let me grab that span.count from the Parliament website, and just report timestamp + count. I had to create a Python virtual env and install some pips, and then I could run this:
import requests
from bs4 import BeautifulSoup
import time
from datetime import datetime
import os
from pathlib import Path

def get_petition_count(url):
    """Fetch the petition count from the given URL."""
    try:
        response = requests.get(url)
        response.raise_for_status()
        soup = BeautifulSoup(response.text, 'html.parser')
        count_element = soup.select_one('span.count')

        if count_element:
            # Remove commas from the number and convert to integer
            count = int(count_element.text.replace(',', ''))
            return count
        else:
            raise ValueError("Count element not found on the page")

    except requests.RequestException as e:
        print(f"Error fetching the petition: {e}")
        return None
    except ValueError as e:
        print(f"Error parsing the count: {e}")
        return None

def log_count(count, filepath):
    """Log the count with timestamp to the specified file."""
    timestamp = datetime.now().strftime('%Y-%m-%d %H:%M:%S')
    log_entry = f"{timestamp},{count}\n"

    # Create directory if it doesn't exist
    Path(filepath).parent.mkdir(parents=True, exist_ok=True)

    # Append to file
    with open(filepath, 'a') as f:
        f.write(log_entry)

    print(f"Logged count: {count} at {timestamp}")

def main():
    url = "https://petition.parliament.uk/petitions/700143"
    log_file = "petition_counts.csv"
    interval = 30 * 60  # 30 minutes in seconds

    # Create/check header in log file
    if not os.path.exists(log_file):
        with open(log_file, 'w') as f:
            f.write("timestamp,count\n")

    print(f"Starting petition count tracker. Logging to {log_file}")
    print(f"Checking every {interval/60} minutes...")

    while True:
        try:
            count = get_petition_count(url)
            if count is not None:
                log_count(count, log_file)

            time.sleep(interval)

        except KeyboardInterrupt:
            print("\nTracking stopped by user")
            break
        except Exception as e:
            print(f"Unexpected error: {e}")
            # Wait a minute before retrying in case of unexpected errors
            time.sleep(60)

if __name__ == "__main__":
    main()
And running that, the output is:
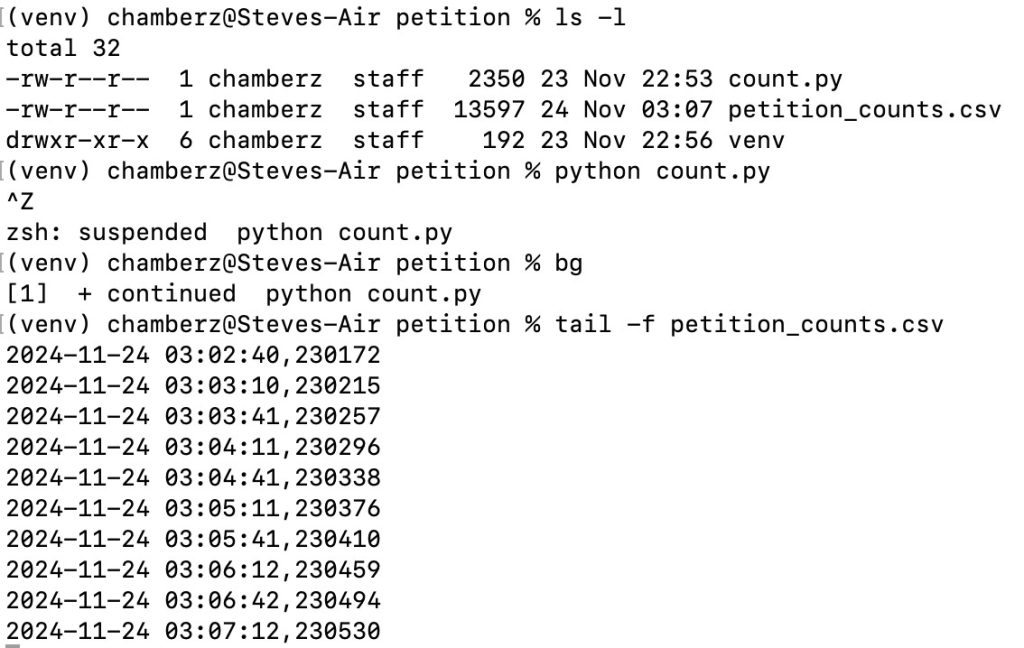
Not very exciting. Not easy to share. All my fellow Brits signing up… if I only knew a way to get a better, more visual version of this onto the internet…
Enter Streamlit and Github.:
- Streamlit for the public interface — charts, figures, hosted on the internet.
- Github for the public code — Python code, the collected petition data.
And Streamlit works “on top of” Github (well, more to the side, but you know what I mean if you’re a software architect type).
Asking ClaudeAI to help write a Streamlit app
So, back to ClaudeAI.
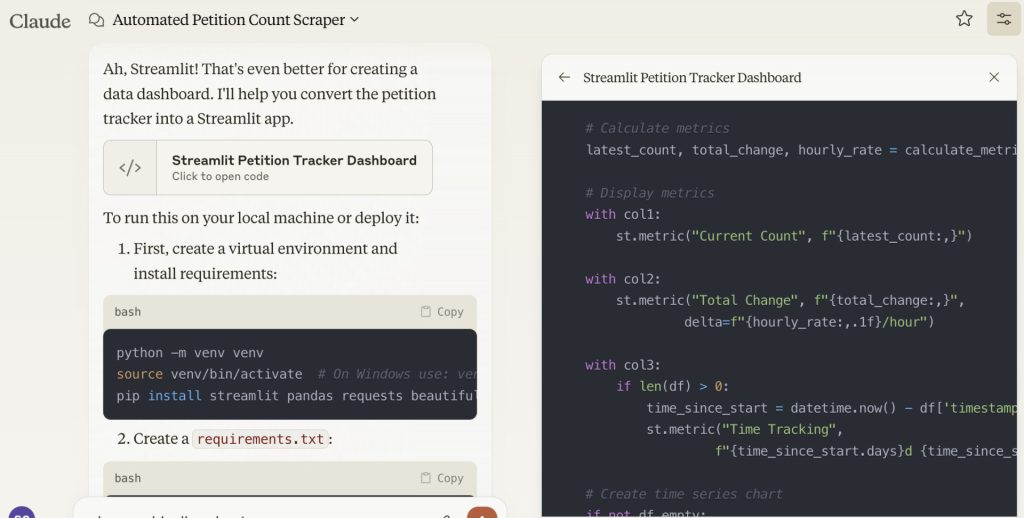
First I confused Replit with Streamlit — hey, as Human League once sang, I’m Only Human — but eventually this is what I got from Streamlit.
This wouldn’t be as simple as running local code on my laptop because, in addition to Python, it needs Github and Streamlit…. I will try to keep this concise! It took a few hours to get everything working.
I had to go through many iterations of the app and I’m going to skip them (tho, arguably, that’s where the value is), and I’m going to skip to the end.
If you’re interested in the “How you got there” story, I can do that. Just ask.
Create a Github repo
For all of this, we need to venture into source code control with Git and the hosted Github.
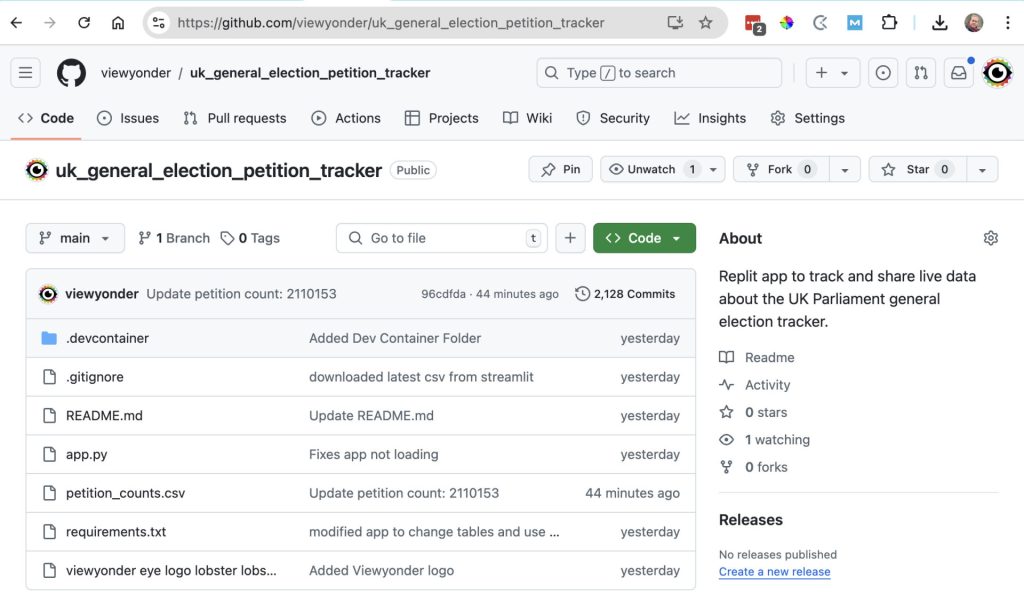
I created a “remote repo” on Github called Viewyonder / UK General Election Tracker.
- I would sync my local code with this remote repository. (So I code locally using VScode on my laptop, and sync changes to Github).
- When I use Streamlit, it will run the code “from” that Github repository *AND* write the petition data to it (using a Python module).
Create a Github access token for the app
For the Python app — whether it ran on my laptop (I can run Streamlit on my laptop) or on the internet (on the Streamlit Community Cloud) — it needs to access the code and write the petition data.
For this I needed a Github token for the repo that contained the code.
That meant adding a new “Github App” and then creating a “classic token”. I used that token as a “secret” later in the app.
Write the Python code for the Streamlit app
By “talking with Claude” and using my existing Python and Streamlit knowledge, we quickly got an app up (in less than an hour). The rest was revisions.
Here’s the Python code on Github for the UK Election Petition Tracker.
import streamlit as st
import pandas as pd
import numpy as np
import requests
from bs4 import BeautifulSoup
from datetime import datetime, timedelta
import plotly.graph_objects as go
from plotly.subplots import make_subplots
import plotly.express as px
import os
import time
import csv
from io import StringIO
from pathlib import Path
import base64
from github import Github
from PIL import Image

# Page config
st.set_page_config(
    page_title="Petition Tracker",
    page_icon="📊",
    layout="wide"
)

# Add some content to dashboard
logo = Image.open('viewyonder eye logo lobster lobster 600x200.png')
st.image(logo)
st.write("A fun little Streamlit app to get the count of signatures every minute from the Parliament petition for a UK General Election.")
st.markdown("🌐 Go sign the petition](https://petition.parliament.uk/petitions/700143)")
st.markdown("Write to your MP with [Write To Them](https://www.writetothem.com/)")

# Initialize GitHub connection
store = Github(st.secrets["GITHUB_TOKEN"]).get_repo(st.secrets["GITHUB_REPO"])

# Initialize session state
if 'last_fetch_time' not in st.session_state:
    st.session_state.last_fetch_time = datetime.min
if 'last_count' not in st.session_state:
    st.session_state.last_count = 0

def get_petition_count(url):
    """Fetch the petition count from the given URL."""
    time_since_last_fetch = datetime.now() - st.session_state.last_fetch_time
    if time_since_last_fetch.total_seconds() < 55:
        return None

    try:
        response = requests.get(url)
        response.raise_for_status()
        soup = BeautifulSoup(response.text, 'html.parser')
        count_element = soup.select_one('span.count')

        st.session_state.last_fetch_time = datetime.now()

        if count_element:
            return int(count_element.text.replace(',', ''))
        return None
    except Exception as e:
        st.error(f"Error fetching count: {e}")
        return None

#def load_data():
#    """Load data from CSV file."""
#    if os.path.exists('petition_counts.csv'):
#        df = pd.read_csv('petition_counts.csv')
#        df['timestamp'] = pd.to_datetime(df['timestamp'])
#        return df
#    return pd.DataFrame(columns=['timestamp', 'count'])

def load_data():
    """Load data from GitHub CSV file."""
    try:
        # Get file content from GitHub
        #file = store.repo.get_contents(store.file_path)
        file = store.get_contents('petition_counts.csv')
        content = base64.b64decode(file.content).decode()

        # Convert to DataFrame
        df = pd.read_csv(pd.io.common.StringIO(content))
        df['timestamp'] = pd.to_datetime(df['timestamp'])
        return df
    except Exception as e:
        # If file doesn't exist or there's an error, return empty DataFrame
        return pd.DataFrame(columns=['timestamp', 'count'])

#def log_count(timestamp, count):
#    """Log count to CSV file."""
#    file_exists = os.path.exists('petition_counts.csv')
#
#    with open('petition_counts.csv', 'a', newline='') as f:
#        writer = csv.writer(f)
#        if not file_exists:
#            writer.writerow(['timestamp', 'count'])
#        writer.writerow([timestamp, count])

def log_count(timestamp, count):
    """Log count to GitHub CSV file."""
    try:
        # Try to get existing file
        try:
            file = store.get_contents('petition_counts.csv')
            # Decode existing content
            current_data = base64.b64decode(file.content).decode()
            # Add new row
            new_data = current_data.rstrip() + f"\n{timestamp},{count}"
            # Update file
            store.update_file(
                'petition_counts.csv',
                f"Update petition count: {count}",
                new_data,
                file.sha
            )
        except:
            # File doesn't exist, create new with headers
            content = f"timestamp,count\n{timestamp},{count}"
            store.create_file(
                'petition_counts.csv',
                f"Initial petition count: {count}",
                content
            )
    except Exception as e:
        st.error(f"Error saving to GitHub: {e}")

def calculate_metrics(df):
    """Calculate metrics including rolling averages."""
    if len(df) == 0:
        return 0, 0, 0, pd.Series(), pd.Series()

    latest_count = df['count'].iloc[-1]

    # Calculate rolling averages
    df = df.set_index('timestamp')
    rolling_5min = df['count'].rolling('5min').mean()
    rolling_15min = df['count'].rolling('15min').mean()

    # Calculate rates using masks instead of last()
    current_time = df.index.max()
    hour_ago = current_time - timedelta(hours=1)
    five_min_ago = current_time - timedelta(minutes=5)

    # Create masks for time periods
    hour_mask = df.index >= hour_ago
    five_min_mask = df.index >= five_min_ago

    # Calculate hourly rate
    if hour_mask.sum() > 1:
        hour_start_count = df.loc[hour_mask, 'count'].iloc[0]
        hourly_rate = latest_count - hour_start_count
    else:
        hourly_rate = 0

    # Calculate minute rate
    if five_min_mask.sum() > 1:
        five_min_start_count = df.loc[five_min_mask, 'count'].iloc[0]
        minute_rate = (latest_count - five_min_start_count) / 5
    else:
        minute_rate = 0

    return latest_count, hourly_rate, minute_rate, rolling_5min, rolling_15min

def create_live_chart(df, rolling_5min, rolling_15min):
    """Create a live-updating chart with rolling averages."""
    fig = make_subplots(specs=[[{"secondary_y": True}]])

    # Raw data
    fig.add_trace(
        go.Scatter(x=df['timestamp'], y=df['count'],
                  name="Raw Count",
                  mode='lines',
                  line=dict(color='blue', width=1)),
        secondary_y=False
    )

    # 5-minute rolling average
    #fig.add_trace(
    #    go.Scatter(x=rolling_5min.index, y=rolling_5min,
    #              name="5-min Average",
    #              mode='lines',
    #              line=dict(color='red', width=2)),
    #    secondary_y=False
    #)

    # 15-minute rolling average
    #fig.add_trace(
    #    go.Scatter(x=rolling_15min.index, y=rolling_15min,
    #              name="15-min Average",
    #              mode='lines',
    #              line=dict(color='green', width=2)),
    #    secondary_y=False
    #)

    # Calculate and plot rate of change using masks
    df_rate = df.copy()
    df_rate['rate'] = df_rate['count'].diff() / ((df_rate['timestamp'] - df_rate['timestamp'].shift(1)).dt.total_seconds() / 60)

    fig.add_trace(
        go.Scatter(x=df_rate['timestamp'], y=df_rate['rate'],
                  name="Rate (signatures/min)",
                  mode='lines',
                  line=dict(color='orange', width=1)),
        secondary_y=True
    )

    fig.update_layout(
        title='Live Petition Count with Rolling Averages',
        xaxis_title="Time",
        yaxis_title="Signatures",
        yaxis2_title="Signatures per Minute",
        hovermode='x unified',
        height=600
    )

    return fig

def create_activity_heatmap(df):
    """Create a heatmap showing signature activity by hour and day."""
    if len(df) < 2:
        return None

    # Add day and hour columns
    df_heatmap = df.copy()
    df_heatmap['hour'] = df_heatmap['timestamp'].dt.hour
    df_heatmap['day'] = df_heatmap['timestamp'].dt.date

    # Calculate signatures per hour using diff
    df_heatmap['signatures'] = df_heatmap['count'].diff()

    # Create pivot table for heatmap
    pivot_table = df_heatmap.pivot_table(
        values='signatures',
        index='day',
        columns='hour',
        aggfunc='sum',
        fill_value=0
    )

    # Create heatmap
    fig = go.Figure(data=go.Heatmap(
        z=pivot_table.values,
        x=pivot_table.columns,
        y=pivot_table.index,
        colorscale='Viridis',
        hoverongaps=False,
        hovertemplate='Day: %{y}<br>Hour: %{x}<br>Signatures: %{z}<extra></extra>'
    ))

    fig.update_layout(
        title='Signature Activity Heatmap',
        xaxis_title='Hour of Day',
        yaxis_title='Date',
        height=400
    )

    return fig

def main():
    st.title("📊 Petition Tracker Dashboard")

    url = "https://petition.parliament.uk/petitions/700143"

    # Create columns for metrics
    col1, col2, col3, col4 = st.columns(4)

    # Load and update data
    df = load_data()
    current_count = get_petition_count(url)

    if current_count is not None and (len(df) == 0 or current_count != st.session_state.last_count):
        timestamp = datetime.now()
        log_count(timestamp, current_count)
        st.session_state.last_count = current_count
        df = load_data()

    # Calculate metrics
    latest_count, hourly_rate, minute_rate, rolling_5min, rolling_15min = calculate_metrics(df)

    # Display metrics
    with col1:
        st.metric("Current Count", f"{latest_count:,}")

    with col2:
        st.metric("Signatures per Hour", f"{hourly_rate:,}")

    with col3:
        st.metric("Signatures per Minute", f"{minute_rate:.1f}")

    with col4:
        if len(df) > 0:
            time_since_start = (datetime.now() - df['timestamp'].iloc[0])
            st.metric("Time Tracking",
                     f"{time_since_start.days}d {time_since_start.seconds//3600}h {(time_since_start.seconds//60)%60}m")

    # Create tabs for different visualizations
    tab1, tab2 = st.tabs(["Live Tracking", "Activity Heatmap"])

    with tab1:
        # Update live chart
        if not df.empty:
            fig = create_live_chart(df, rolling_5min, rolling_15min)
            st.plotly_chart(fig, use_container_width=True)

            # Show recent data
            st.subheader("Recent Readings")
            n_recent = 10

            # Create recent dataframe with rate calculation
            recent_df = df.copy().sort_values('timestamp', ascending=False).head(n_recent)
            # Calculate rate (signatures per minute)
            recent_df['rate'] = recent_df['count'].diff(-1).abs() / \
                            (recent_df['timestamp'].diff(-1).dt.total_seconds() / 60)

            # Select and rename columns
            display_df = recent_df[['timestamp', 'count', 'rate']].copy()

            # Format the dataframe for display
            st.dataframe(
                display_df.style.format({
                    'timestamp': lambda x: x.strftime('%Y-%m-%d %H:%M:%S'),
                    'count': '{:,}',
                    'rate': '{:.1f}'
                }),
                use_container_width=True
            )

    with tab2:
        # Display activity heatmap
        if not df.empty:
            heatmap_fig = create_activity_heatmap(df)
            if heatmap_fig:
                st.plotly_chart(heatmap_fig, use_container_width=True)

                # Add summary statistics
                st.subheader("Activity Summary")
                df_summary = df.copy()
                df_summary['hour'] = df_summary['timestamp'].dt.hour
                df_summary['signatures'] = df_summary['count'].diff()

                hour_sums = df_summary.groupby('hour')['signatures'].sum()
                peak_hour = hour_sums.idxmax()
                peak_signatures = hour_sums.max()

                col1, col2 = st.columns(2)
                with col1:
                    st.metric("Peak Activity Hour", f"{peak_hour:02d}:00")
                with col2:
                    st.metric("Peak Hour Signatures", f"{int(peak_signatures):,}")

    # Auto-refresh
    time.sleep(1)
    st.rerun()

if __name__ == "__main__":
    main()
Run the app locally on laptop
One of the many lovely things about Streamlit is that you can run it locally on your laptop… then Deploy it to the Streamlit Community Cloud.
Running locally, it starts a webserver and sends you on a local port… then you can click Deploy, do all the Streamlit setup, and your app is live…
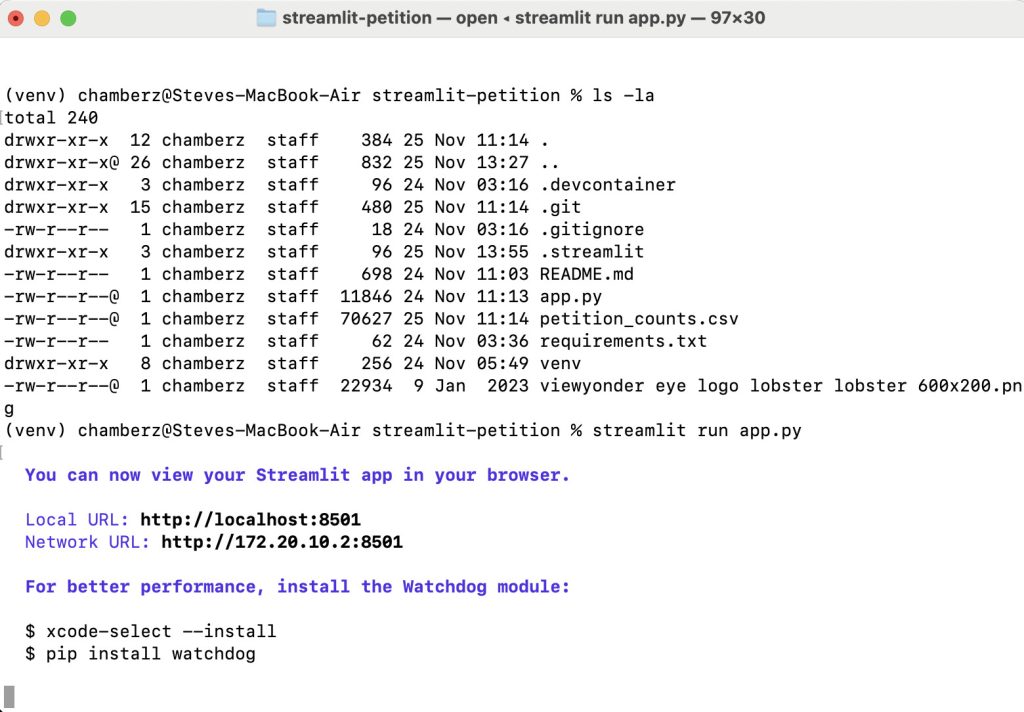
And in a browser:
Deploying the UK Petition Tracker to Streamlit Community Cloud
I wanted to share the petition tracker to the world and I can’t do that with an app running on my laptop (well I can, but that’s way to technical). So I opted to deploy the locally running app to Streamlit Community Cloud — it’s free!
Because my code is working, in Python, and on Github, and built for Streamlit locally… this is *dead easy*.
In the local app, in the browser, click Deploy… make sure to put your secrets in (Github token, repo, and CSV filename in github). Et voila:
Sharing the UK Petition Tracker online
I’m mostly an X user, so I’ll give some examples. I posted my progress on X, and I tagged people, and replied to others. Most people ignored me, some loved it, and some negged me about the petition being a waste of time.
I appreciate those that supported my private, free endevour!
C’est ça.
